Leveraging AI
How to build an AMS, off-season championship tracker, or performance tracking dashboards on your own.

Software companies have taken over the field of performance in recent years. It seems everyone is now outsourcing the production of visuals, AMS, etc., to companies for, in many cases, the price of an extra staff member in salary per year or more.
That model is dead.
With the advancement in AI, anyone who knows exactly what they want, can ask the right questions, and build the right prompts, can have a superior product with a 20 dollar a month membership to Claude or any other coding capable AI.
You don’t need a $40,000 AMS subscription. You don’t need to wait on an IT department. You don’t need to hire a developer. Claude can build you a professional-grade athlete monitoring system. You can start smaller with performance profiles that used to take forever to build on Excel, that you can now build in a day. You can automate an off-season championship tracker. Anything that requires handling data, sharing data, and automating the process can be done with a little practice.
This is not a theoretical piece. The tools are built and they work.
THE PROBLEM WITH OFF-THE-SHELF SOFTWARE
Every major AMS platform gives you the same pitch: data entry, leaderboards, athlete profiles. You pay a monthly fee. You get locked into their data format. You get features you don’t want and miss the ones you do.
The pitch assumes you can’t build your own. For the last decade, that assumption was correct. Or if it wasn’t correct, you probably wasted countless hours trying to build out dashboards and failed, or succeeded but at what cost?
That is not the case anymore.
WHAT CLAUDE ACTUALLY DOES
For our purposes, it is a code-generation engine that understands plain language.
The workflow is this:
You describe what you want. Explain why you want to build, how it is going to operate, and be as detailed as possible. Claude will do the work for you building out a fully capable HTML file in minutes. From here, iterate and improve it with small tweaks until you get exactly what you want.
That loop, repeated across a few hours, produces software that would have taken a developer days or weeks to build. No prior coding knowledge required. No terminal commands. A single HTML file that opens in any browser, runs offline, and belongs entirely to you.
We have utilized this to build out full athlete monitoring systems for multiple teams this year as a pilot, and they worked with incredible success. This coming year, every team on campus will have its own AMS. We have also utilized performance trackers for teams without a full AMS and built off-season championship trackers for a few teams to enhance the off-season experience.
We have linked all of our data to Supabase, which, if you are going the route of full AMS, is critical for speed and ease of use. I will cover that towards the end of this article.
Two of the tools we have implemented are explained below.
TOOL 1: PERFORMANCE ANALYTICS DASHBOARD
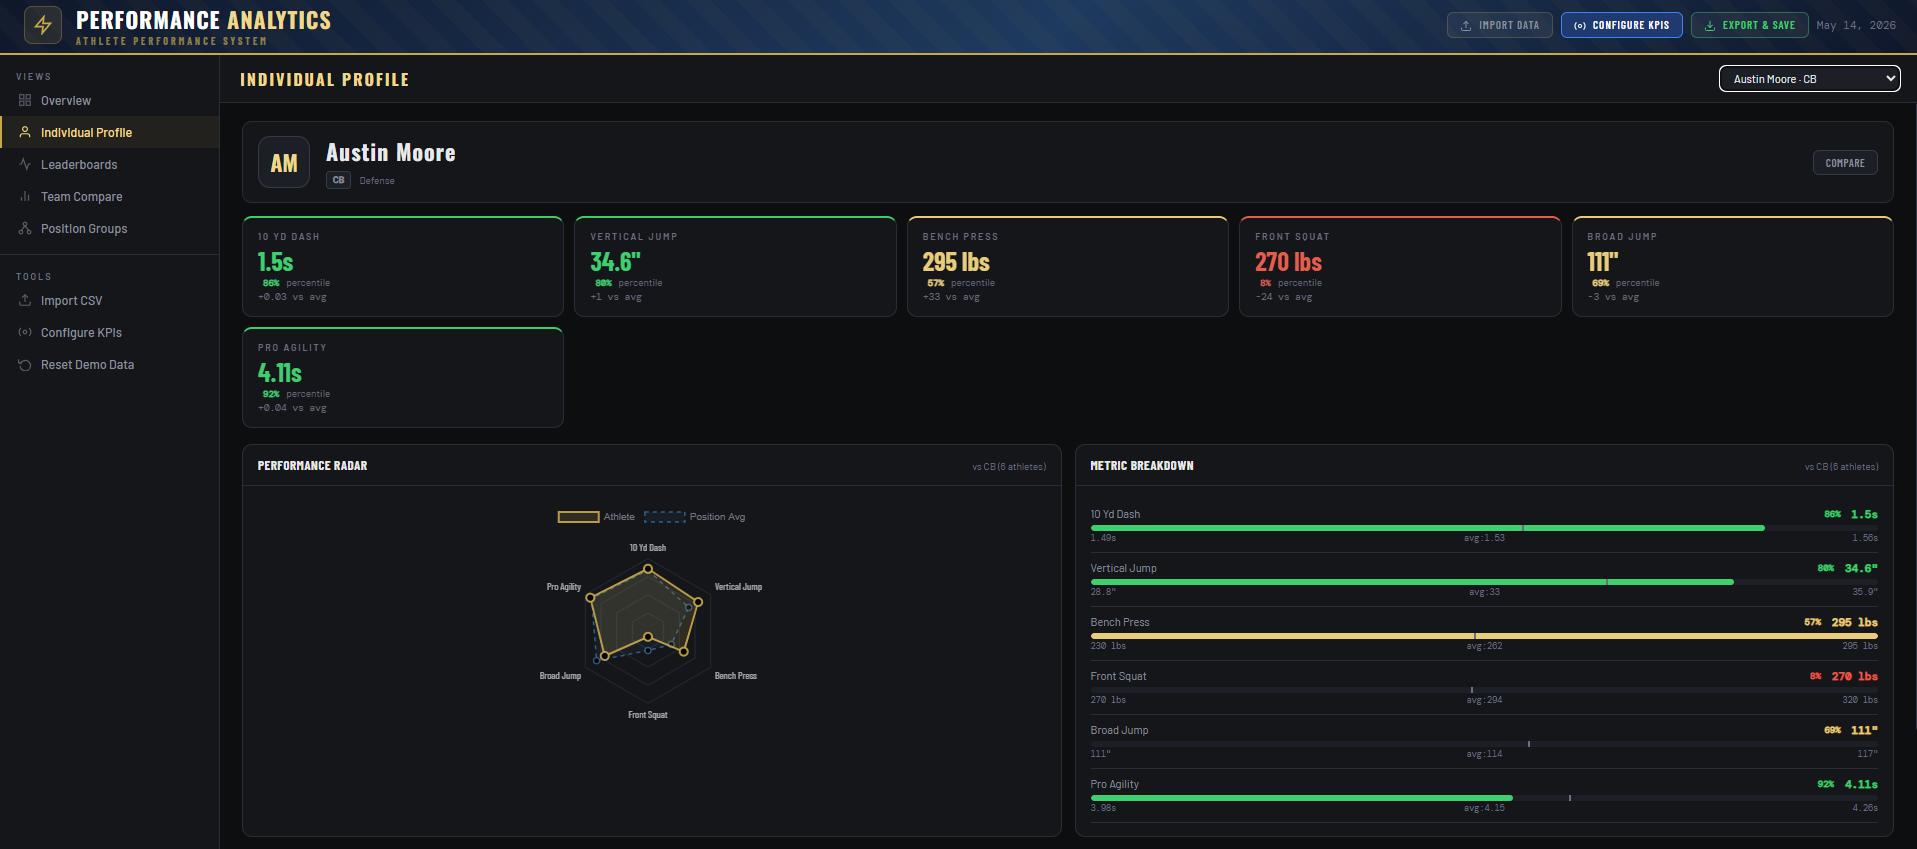
What it is: A complete athlete performance management system built as a single HTML file. Drop it in any browser. No installation. No server. No account.
*All data shown is demo data
What it does:
Overview: Team-wide KPI summary. Tiles for each metric with color-coded performance tiers. At a glance you know where your roster stands.
Individual Profile: Full athlete card with KPI tiles, percentile rankings vs. position group, performance radar chart, and metric breakdown bars. The profile shown in the screenshots pulls 10 Yd Dash, Vertical Jump, Bench Press, Front Squat, Broad Jump, and Pro Agility. Every metric compares the athlete against their position peers, shows the vs. average delta, and highlights red when they’re below the group floor. The KPI’s are easily adjustable within the HTML file.
Leaderboards: Ranked list for any metric across the full roster or filtered by position. One click sorts the entire team. Percentile scores auto-calculate from the distribution. You can see immediately that Kyle Moore’s 1.46 is in a different tier than the next cluster at 1.52.
Team Compare: Head-to-head athlete comparison with bar chart matchup for every metric and a side-by-side radar. Color codes the winner on each metric. Useful for depth chart decisions, position battles, and conversations with athletes.
Position Groups: Position-specific leaderboards with tier distribution breakdown. Shows how each unit stacks on each KPI from Elite through Develop. Identifies exactly which position group has the most development need at which metric.
What makes it actually useful:
The KPI system is fully configurable. You can toggle any metric on or off, set custom lo/hi thresholds, and add custom metrics beyond the defaults. The direction logic is built in; lower is better for sprint times, higher is better for jumps and lifts. The dashboard handles the math.
Import is a CSV. Headers are flexible, it accepts “name,” “athlete,” or “player” for the name column, and maps column headers to metrics automatically. You export your team data from your current spreadsheet, drop it in, done.
Export and Save produces a self-contained snapshot HTML file with your data baked in. Date-stamped. Shareable. No cloud dependency.
The entire thing is 1,182 lines of code. Claude wrote it. I described what I needed.
If you want to skip the front-end work, you can snag yours here.
TOOL 2: OFF-SEASON CHAMPIONSHIP TRACKER
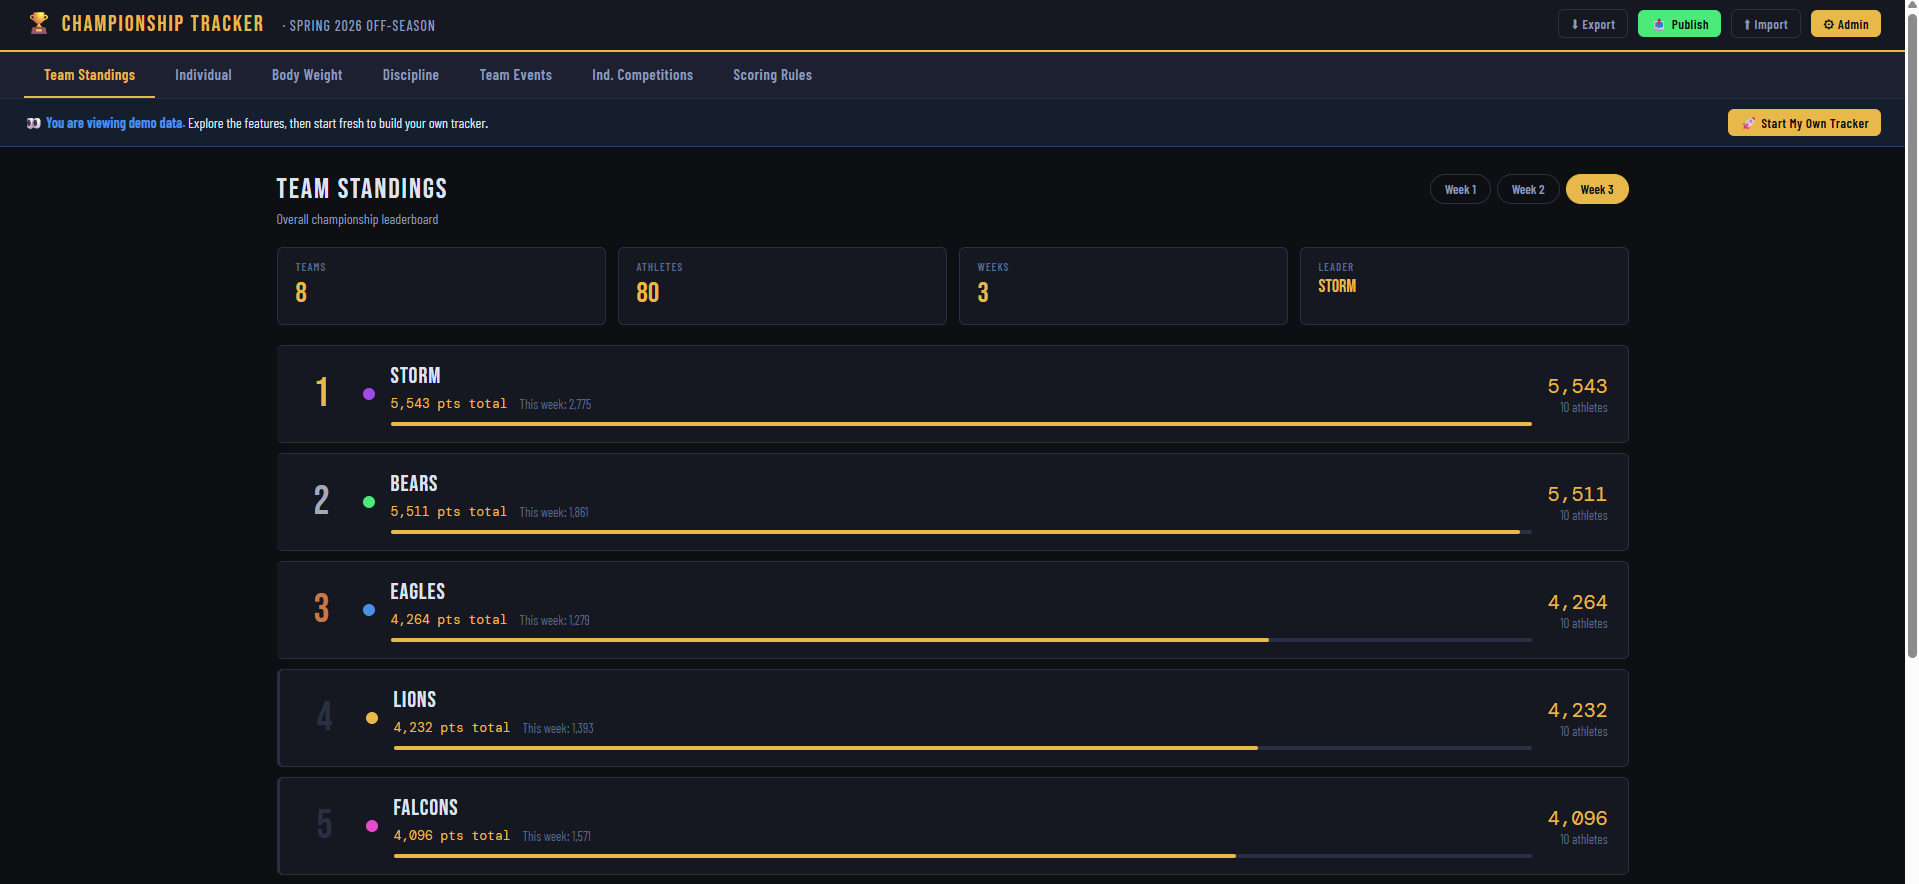
What it is: A full offseason competition management system. Point-based team standings with multi-category scoring, individual leaderboards, violation tracking, and admin controls.
The concept is simple: take the offseason and make it competitive. Divide your roster into teams. Score everything. Put standings on a screen in the weight room, give the link to coaches and athletes.
This is something I utilized early in my career and went away from because of the time burden it created. Trying to track everything in Excel and manage the standings and points, it didn’t feel like the juice was worth the squeeze. Now it couldn’t be easier with the off-season championship tracker. I simply import my TeamBuildr data, and everything is automatically updated.
*Data shown is demo data
What it does:
Team Standings: Weekly standings with point totals, this-week breakdowns, and a progress bar scaled to the leader. Supports up to 8 teams. The screenshots show 80 athletes across 8 teams over 3 weeks. Storm leads with 5,543 points. Bears at 5,511.
Individual Standings: Athlete-level point totals across all weeks. Cross-team individual rankings with search. Every athlete’s contribution is visible. Morrison James at 705 points owns the lead regardless of team standing.
Body Weight: Weekly weigh-in tracking against individual season goals and rolling current goals. ±3 lb window = HIT. Outside = MISS. NT for no-shows. Auto-calculates points per result. Imports via CSV. Week 3 in the demo shows 54 hits, 17 misses, 9 NT from 80 athletes. That data takes less than a minute to enter.
Discipline: Violation log with point deductions. Standard violations at -25 (dress code, lack of detail, etc.). Severe violations at -250 (missed/late to training). Clean Teammate Credit at +100. When an athlete has zero negative point violations for a week they receive a bonus for doing the right things. This creates genuine peer accountability. 12 violations totaling -1,425 points deducted in the demo.
Team Events: Group competition results by week. Place-based scoring. Tracks, tug of war, sprint races, whatever you run. The first-place team takes 1,000 points. Scale steps down from there.
Individual Competitions: Event results for individual athletes. Supports subgroup scoring, such as Skill vs. Line, for example. The vertical jump competition screenshot shows Fitzgerald Collins at 40” winning overall, with a separate Line leaderboard at 29” for multiple athletes. You can run the same competition and score skill guys against skill guys, linemen against linemen. These subgroups are adjustable based on your team's needs directly within the file.
Scoring Rules: All point values are editable by an admin in real time. BW window, hit points, miss points, violation severities, team ranking scale, bonuses. Every rule change propagates instantly through all historical calculations. You set the incentive structure. The system enforces it.
What makes it actually useful:
The admin lock. A hashed password protects rule editing and data entry. Athletes can view the public standings on a projected screen or shared link without being able to alter anything.
CSV import for every data type: body weight, discipline violations, team events, individual competitions. If your sports science staff is already tracking weigh-ins in a spreadsheet, the import is three columns and a paste.
If you don’t have a CSV file, you are old school and go pen and paper. Simply take a picture and upload it to Claude with the prompt “Make this into an alphabetical CSV file. Or take your handwritten data and put it into Excel yourself if you like to waste time.
Export creates a dated JSON backup of the entire database. Import restores from that backup. You never lose a season.
The whole system runs on localStorage in the browser. No server. No accounts. No subscription. Open the file, configure your teams and roster, start entering data. 2,723 lines of code. Built in a single Claude session.
THE FULL AMS: HOW THIS SCALES WITH SUPABASE
The two tools above are self-contained. Powerful for most programs. But the full vision of what you can build with Claude goes further.
Here’s what the architecture looks like when you add a database backend:
Supabase is a free-tier database platform with an API layer. Claude can write the code that connects your HTML dashboard to a live database. Instead of a CSV import, you or your sports science staff enters data once and every coach sees it in real time. Instead of localStorage, data lives in the cloud and persists across devices.
What that unlocks:
Live data sync across staff laptops, iPads, and phones
Athlete login to view their own profile
Automated weigh-in reminders via email or text
Historical tracking across multiple seasons
Role-based access: coaches see everything, athletes see only their data
Dashboard embeds on your program website or LMS
The prompt workflow for building this is the same. You describe the feature. Claude writes the connection code, the database schema, the API calls. You test it. You iterate.
The performance dashboard I built can be extended to a full AMS in this way. The components already exist: athlete profiles, position groups, KPI tracking, comparative analysis. Connect it to Supabase and you have a system that rivals platforms charging thousands per year.
Ours tracks performance metrics, GPS, readiness testing through force plates, and athlete availability.
The core difference between a $5,000 AMS and what I built is not features. It is delivery model. They have infrastructure you are paying for. When you build your own, you own the infrastructure.
For a full customized AMS, or a custom performance tracker/off-season tracker you don’t have to build, just reach out to dimarcoperformancesolutions@gmail.com.
WHY THIS MATTERS FOR COACHES
You need the data presented clearly, compared correctly, and updated in real time. You need tools built around the specific metrics you track, the position groups you run, and the offseason structure you design.
Off-the-shelf software is built around generic programs. What you can build with Claude is built around yours.
The time cost is measured in hours, not weeks. The financial cost is zero or close to it. The output is a professional-grade tool that you own, that runs offline, that has no subscription fee, and that you can modify the moment your program changes.
This is not the future of coaching technology. It is available right now. '
Coaches are already taking notice and utilizing this. I know many within my network are already utilizing this exceptionally well. The Morning Rep account on social media has created some form of an AI playbook that I have not checked out since I have already been utilizing AI for quite some time for this, but it is probably worth your time if you are not yet comfortable with utilizing AI.
THE BOTTOM LINE
You don’t need to know how to code. You need to know what problem you’re trying to solve. Claude handles the translation. The performance dashboard tracks testing data, compares athletes by position, and generates professional profiles you can hand to a head coach or put in front of a recruit. The championship tracker turns your offseason into a competition with real stakes, real accountability, and a scoreboard every athlete can see. Both are available now. Build your own version in a few days. Or buy the template and have it running by tonight.
Get the tools:
This is the shift most people miss - the build cost of an AMS or a tracking dashboard has basically collapsed. I’m doing the work of a small team solo right now because the bottleneck moved from “can you build it” to “do you know which number actually matters.” The dashboards are easy now; the discipline to not measure everything is the hard part. Nice piece.
Do you need to keep the Claude subscription after you build the dashboards?